While work occupies a substantial part of our lives, the way societies navigate the delicate balance between professional obligations and personal time varies remarkably across the globe. While in some nations, long hours and relentless productivity are hailed as virtues, others place greater emphasis on leisure activities, restorative rest, and mental well-being.
To uncover where people enjoy the healthiest equilibrium between work and life, TradingPlatforms analysed data from the OECD and World Happiness Report, comparing 30 developed economies across factors such as average leisure time, annual working hours, happiness levels, daily commute duration, disposable income, and paid leave allowances.
The resulting Work-Life Balance Index reveals the countries that offer their citizens the best combination of free time, financial security, and overall life satisfaction, and those where the daily grind still dominates.
Key takeaways
- Finland ranks as the country with the best work-life balance, scoring 73.4 out of 100 points on the index.
- People in Greece enjoy the shortest commute to work of all 30 countries in our study, spending an average of 40 minutes travelling each day.
- Germans boast the shortest annual working hours, 1,331 hours per year, giving them plenty of time for leisure: 331 minutes a day, in fact.

The results of the 2025 Work-Life Balance Index reveal clear differences in how daily life unfolds across the globe. Finland ranks first with a score of 73.4 out of 100 points, combining moderate working hours, more than five and a half hours of leisure time each day, and generous paid leave. Close behind are Luxembourg (72.82/100), Norway (70.26/100), Denmark (68.91/100), and the United States (68.41/100). These countries balance high disposable income with flexible working cultures, generally shorter commutes, and high levels of personal well-being.
At the other end of the scale, Turkey ranks lowest of all 30 countries, with an index score of 24.5 out of 100 points, followed closely by Mexico (28.9/100), and Korea (30.3/100). Workers in these nations record significantly longer working hours, averaging over seven hours a day in Turkey and Korea, and face limited leave entitlements, as well as lengthy commutes. Mexico, notably, has the longest average working day and the least time for leisure activities, with employees spending an average of 8 hours and 36 minutes at work and just 2 hours and 52 minutes on hobbies and sport each day.
How Did We Come Up to These Conclusions?
The 2025 Work-Life Balance Index goes beyond simply measuring how much people work or rest in different countries. It is a composite metric calculated based on a set of indicators that consider not only hours spent working but also income, leisure time, and the paid time off workers can enjoy. Nations are ranked according to several key dimensions:
- Average annual working hours – average number of working days for full and part-time workers;
- Travelling to and from work (hours per day);
- Leisure time – hours per day spent on hobbies, sport, any other activities different from work, study, sleep, self-care, and chores;
- Disposable income – income remaining after deduction of taxes (income tax, national insurance, council tax, federal tax, etc.);
- Paid time off work – days of annual paid leave plus public holidays;
- Happiness score – score between 1 and 10 based on the World Happiness Report data.
The Most Surprising Work-Life Balance Findings of 2025
-
Mexico – Overworked but surprisingly happy
- Leisure: 172 min/day (lowest)
- Hours worked/year: 2,193 (highest)
- Paid leave: 13 days (very low)
- Gross income: $17,736 (lowest)
- Happiness: 6.979 (higher than the USA and Japan)
Insight: Despite extreme overwork and low pay, happiness is relatively high. Likely cultural/social cohesion factors dominate.
-
Korea – Commute destroys balance
- Commute: 116 min/day (longest in dataset)
- Hours worked/year: 1,865 (very high)
- Leisure: 258 min/day
- Happiness: 6.038 (low)
- Work–Life Balance Index: 30.33 (lowest)
Insight: Long commuting time nullifies the potential benefits of moderate leisure and income.
-
Finland – Happiness beats leisure
- Leisure: 331 min/day (less than Norway 368)
- Paid leave: 36 days (high)
- Happiness: 7.736 (highest)
- Work–Life Balance Index: 73.39 (highest)
Insight: Shows that the quality of leave and work culture matters more than total leisure minutes.
-
Greece – Lots of leisure, low happiness
- Leisure: 341 min/day (among the highest)
- Work hours/year: 1,898 (very high)
- Happiness: 5.776 (low)
Insight: High leisure does not compensate for long working hours, moderate income, or economic stress.
-
United States – High income, poor leave
- Income: $62,722 (highest)
- Paid leave: 10 days (statutory minimum 0)
- Happiness: 6.724 (moderate)
- Work–Life Balance Index: 68.41 (5th overall)
Insight: Shows that money can’t fully substitute for paid leave or time balance.
-
Japan – Many holidays, low balance
- Public holidays: 19 (highest)
- Work hours/year: 1,617
- Commute: 80 min/day (long)
- Happiness: 6.147 (low)
- Work–Life Balance Index: 38.64
Insight: : Even with many holidays, long commutes and work culture create a poor work-life balance.
-
Turkey – Time balance illusion
- Time Balance subindex: 92.11 (very high)
- Happiness: 5.262 (very low)
- Hours worked/year: 1,796
Insight: Metrics suggest good time balance, but subjective happiness is very low. a mismatch between measured indicators and lived experience.
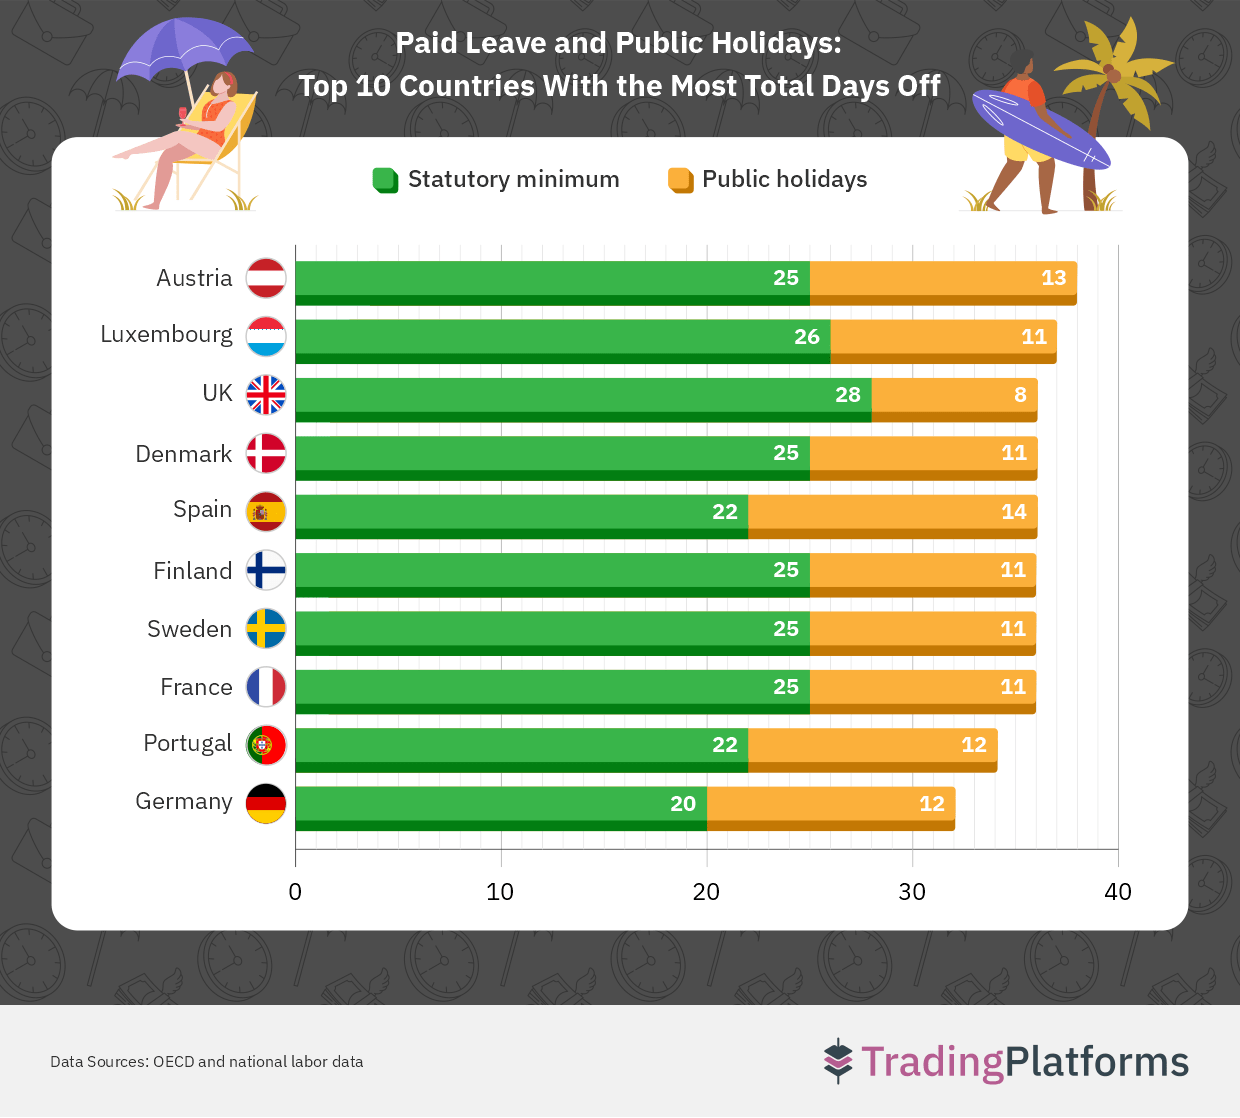
Time off for travel, family, and personal pursuits is a cornerstone of a healthy work-life balance, and it is no surprise that the countries with the most balanced lifestyles also offer the highest number of paid days off. Austria leads the way with a total of 38 paid days per year, combining 25 statutory leave days with 13 public holidays for 2024. Close behind are Luxembourg, with 37 paid days off work, and the United Kingdom, Denmark, Spain, Finland, Sweden, and France, each offering 36 days. Portugal and Germany complete the top ten with 34 and 32 days, respectively. The fact that all of the top ten countries in this category are European clearly highlights the region’s strong cultural and policy emphasis on rest and recreation.
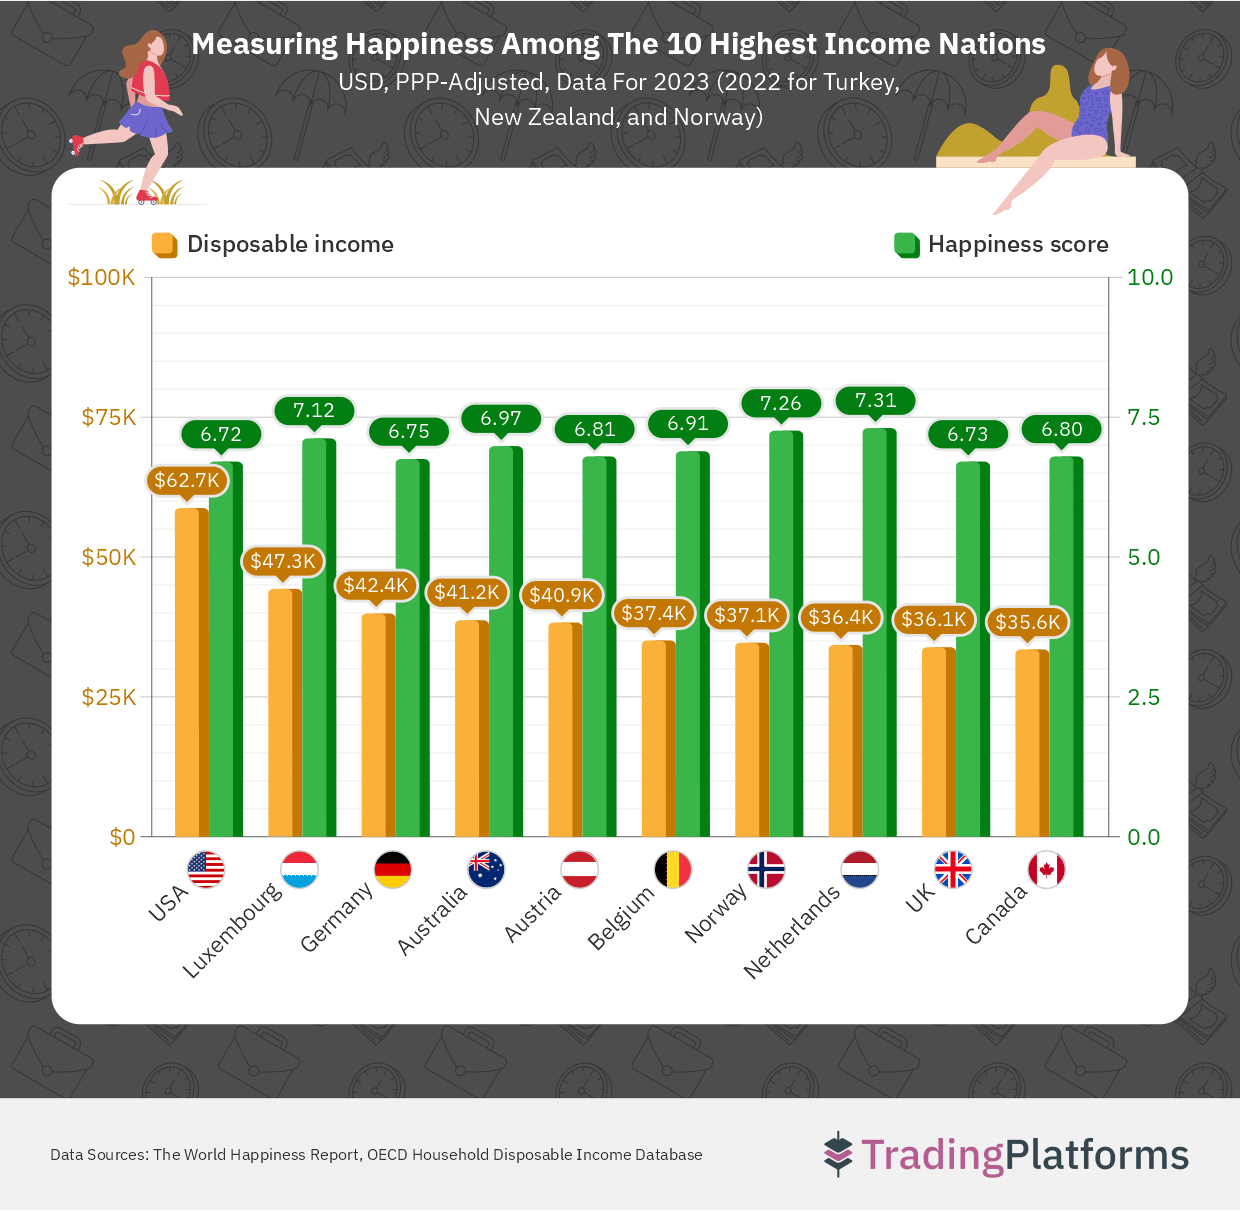
Money cannot buy happiness, or at least, data suggests it cannot. When citizens of some of the world’s most affluent nations were asked to rate their quality of life on a scale from 0 to 10, the results challenge conventional wisdom. Despite households in the United States having the highest average disposable income at $62,722, Americans recorded the lowest happiness score among the top ten countries. In neighbouring Canada, where the average income is almost half that amount at $35,561, people rated their happiness more than three points higher.
Norway, the Netherlands, and Luxembourg exemplify a rare balance of high earnings and high life satisfaction, reflecting strong social systems and healthier work cultures. Meanwhile, countries such as Germany and Austria demonstrate that wealth can enhance well-being, but only up to a point; beyond that, quality of life depends as much on how people live as on how much they earn.
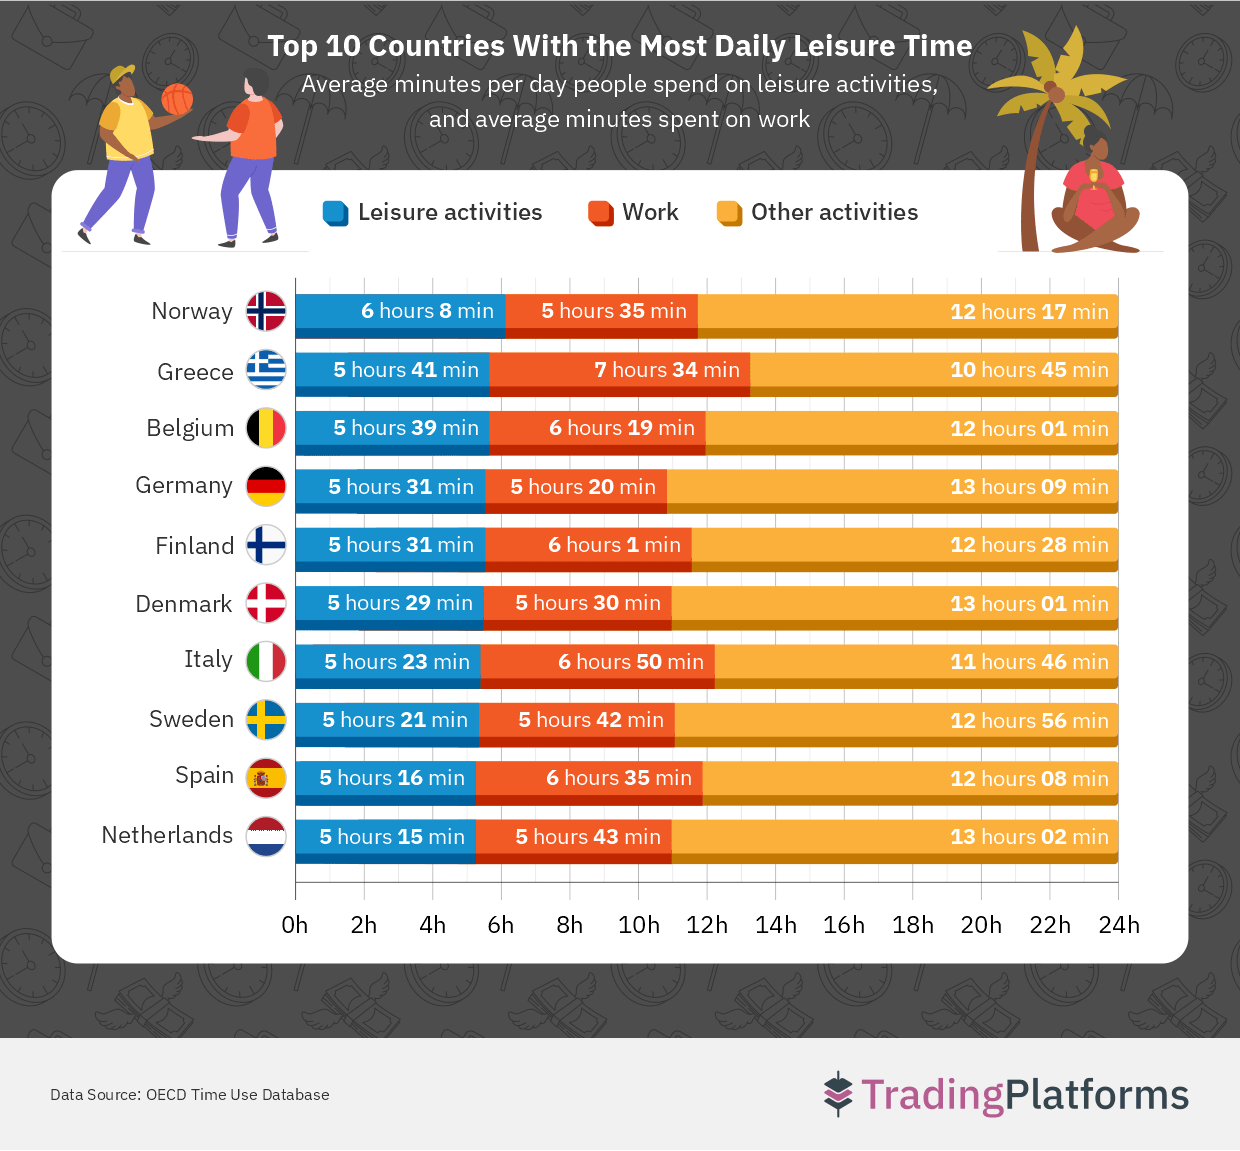
Leisure time encompasses the hours people spend outside of work dedicated to rest, recreation, and personal enjoyment. Norwegians enjoy the most free time, averaging just over six hours of leisure activities per day, a reflection of the country’s deep-rooted culture of work-life balance and flexible schedules. Close behind are Belgium and Finland, where people also devote more than five and a half hours each day to hobbies, socialising, and relaxation, illustrating how carving out time for oneself can enhance overall happiness and well-being.
Meanwhile, countries like Germany, Denmark, and the Netherlands show that it is possible to maintain high productivity without sacrificing free time. Shorter working days are paired with generous opportunities to recharge, demonstrating that efficiency and leisure can go hand in hand.
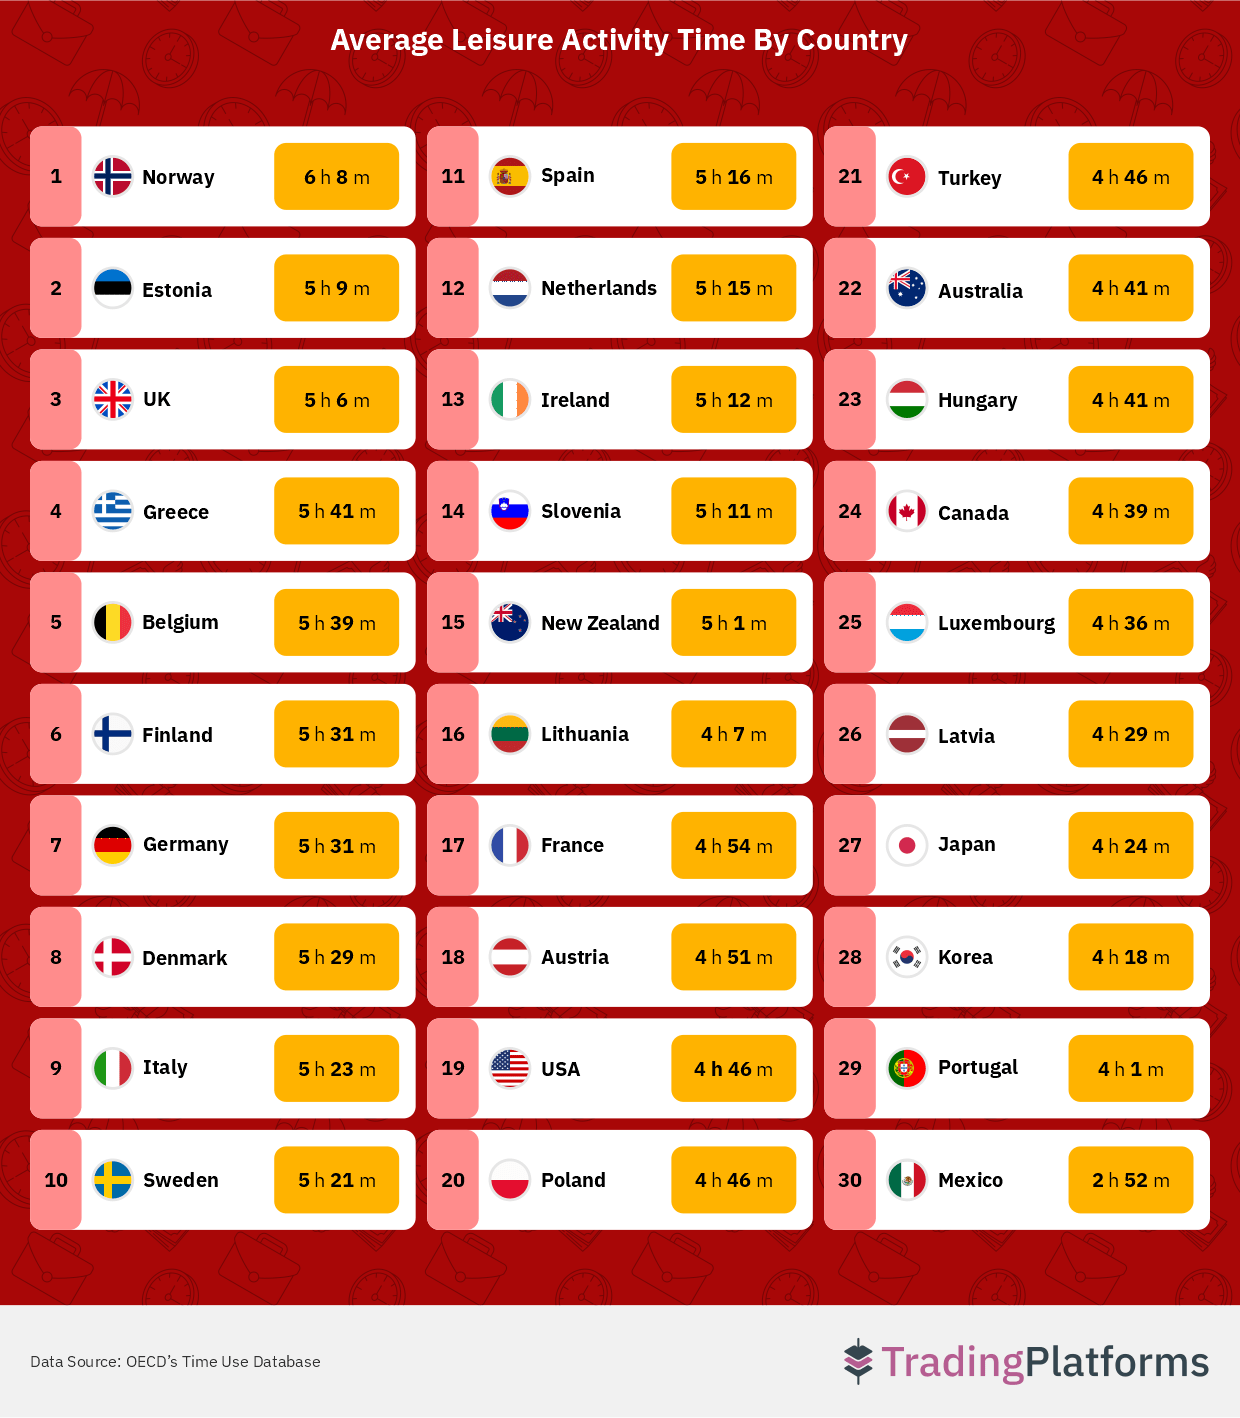
Across the 30 nations analysed, the contrast in daily leisure time is stark and insightful. Norway stands out as the top-ranking nation, with citizens enjoying over six hours of leisure activities per day, primarily due to shorter average working hours and a strong social emphasis on personal time. Other Northern European nations like Finland, Denmark, and Germany also score high, managing to maintain both productivity and balance.
At the other end, countries like Mexico, Portugal, Korea, and Japan show a far bleaker picture; people there have barely four hours, or in Mexico’s case, under three, to themselves each day (not counting sleep, of course). Long working hours and limited rest clearly eat into personal time, leaving little room for relaxation.
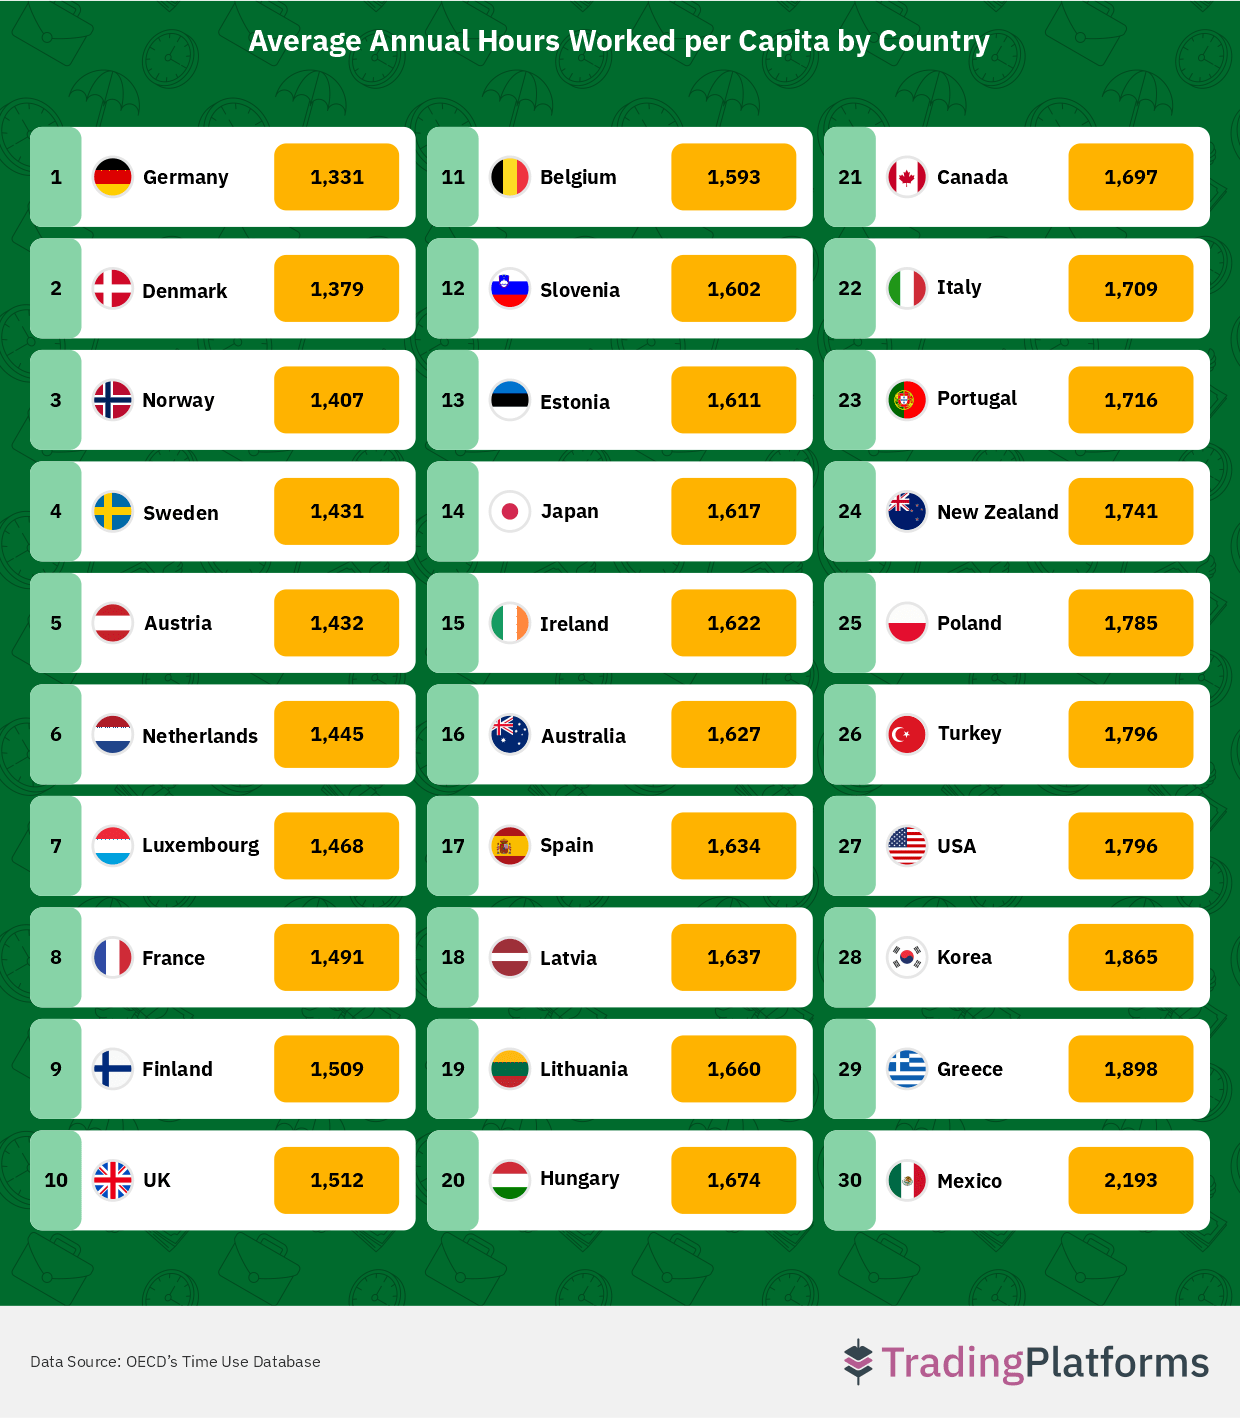
Comparing the average annual working hours per person across these countries reveals notable contrasts. On the one hand, it highlights how developed nations such as Germany, Denmark, Norway, and Sweden have managed to keep their populations productive without overburdening them with gruelling working hours. At the same time, it exposes a stark reality in countries such as Korea, Greece, and Mexico, which record the highest average working hours among the 30 nations analysed. Furthermore, home working, hybrid arrangements, flexible hours, and well-paid part-time roles all contribute significantly to the lower average hours observed in Western and Northern European countries.
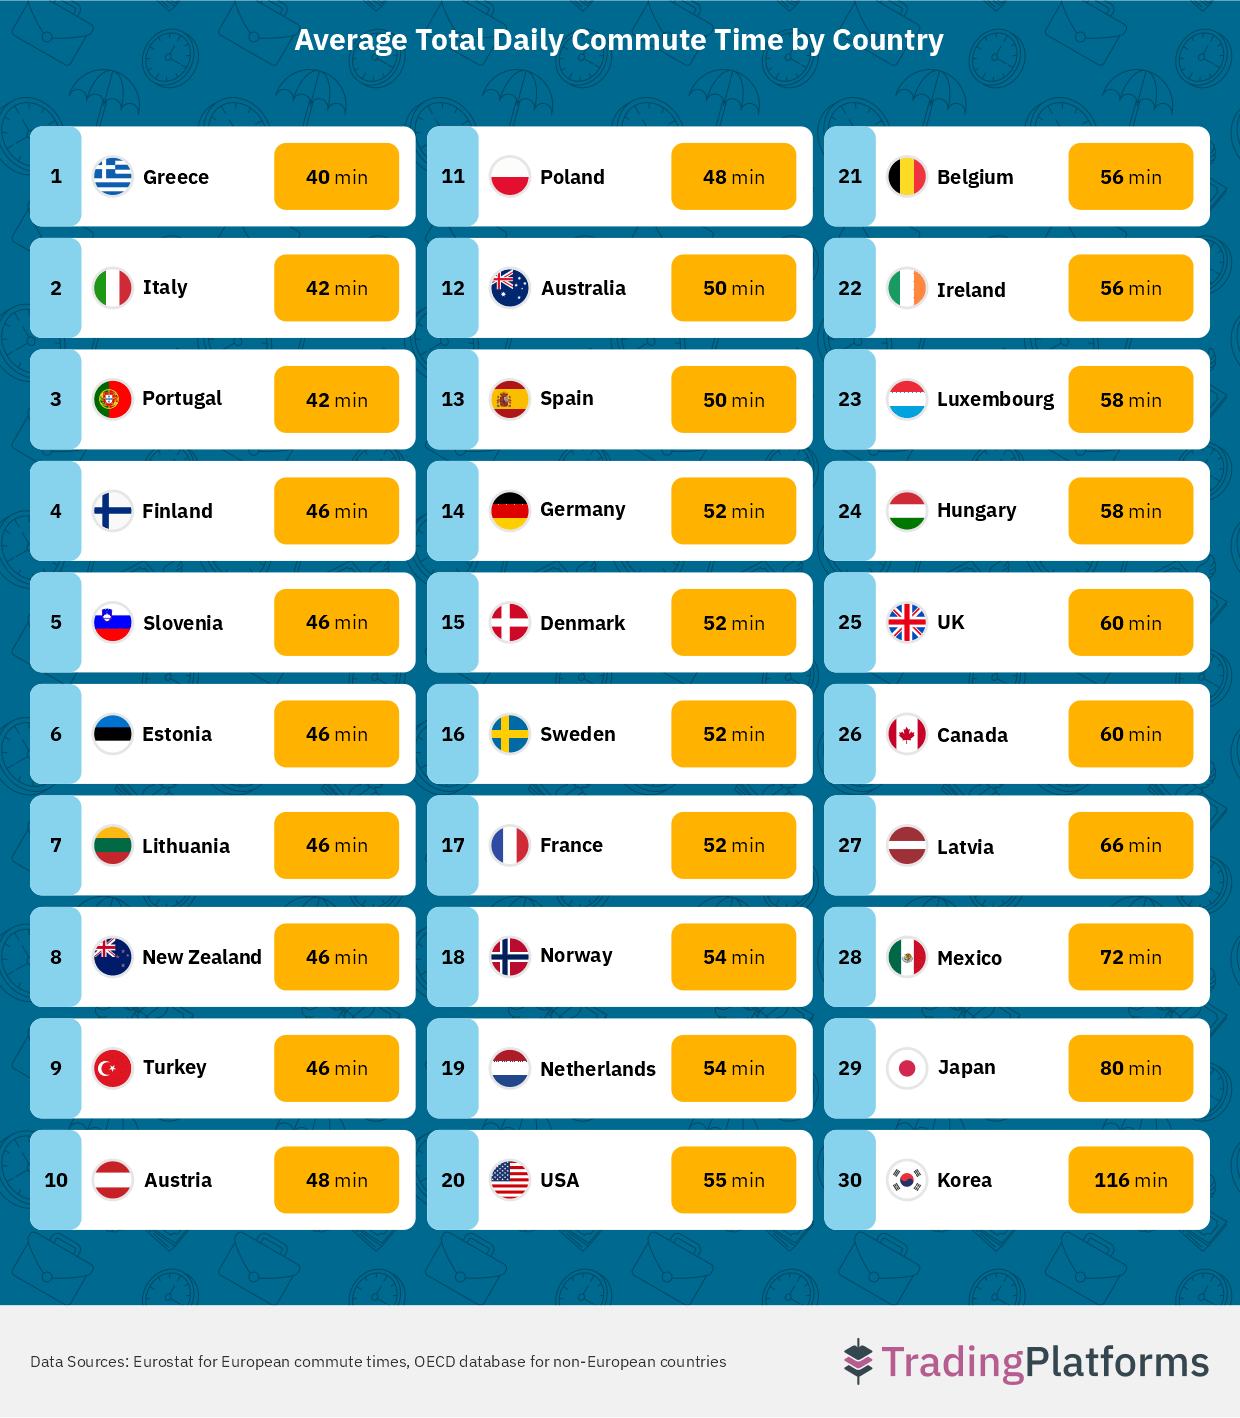
Commute times vary dramatically across the world, and are mostly affected by geography, infrastructure, and work culture. Korea records the longest hours of travelling to and from work at 116 minutes a day, nearly a two-hour work commute, driven by dense urban centres and high housing costs that push workers farther from city centres. Japan (80 minutes) and Mexico (72 minutes) face similar issues, with sprawling metropolitan areas and heavy reliance on public transport contributing to longer journeys.
In contrast, smaller and more efficiently connected nations such as Finland, Denmark, Slovenia, and New Zealand report two-way commutes under 50 minutes a day on average. These shorter travel times often correlate with compact city planning, robust public transport systems, and, in some cases, greater adoption of flexible or remote work policies. Meanwhile, European countries like Belgium, Ireland, and the UK, with average commutes around an hour, fall somewhere in the middle due to a mix of urban congestion and well-developed transport networks.
Methodology
To rank countries by their overall work-life balance, the team at TradingPlatforms combined several key indicators rather than relying on a single measure such as working hours or income. Each country’s Work-Life Balance Index score was constructed from seven measurable dimensions: leisure time, annual working hours, total paid leave days, commute time, happiness, and gross disposable income per capita.
For leisure time and working hours, we used the latest data from the OECD’s Time Use Database and Hours Worked dataset (2023-2024), which measures the average amount of time people spend outside work and the average number of hours worked annually. Total paid leave days were calculated by combining the statutory minimum annual leave entitlement with the number of public holidays, based on OECD Family Database figures.
Commute time data represent the average number of minutes spent travelling on a typical weekday. Figures for European nations were sourced from Eurostat’s Main Place of Work and Commuting Time database, while global averages were drawn from the OECD dataset.
The Happiness Score was derived from the World Happiness Report (2024), which assesses life satisfaction on a scale from 0 to 10. Gross Disposable Income per Capita data were taken from the OECD’s Household Disposable Income indicator, reflecting the average amount of money available to households after taxes and transfers.
To create the Work-Life Balance Index, all indicators were standardised on a 0–100 scale, where favourable metrics such as greater leisure time and higher income increased the overall score, while negative factors such as longer working hours or commutes reduced it. The results were then grouped into three equally weighted subindices – Time Balance, Happiness, and Income – which were averaged to form the final index. Data availability varies slightly across sources and years, but the most recent comparable figures were used wherever possible.