Intelligence at the national level is often judged by visible achievements – innovation output, research leadership and academic prestige – but these outcomes are ultimately driven by human capital. The strength of a country’s education system, research workforce and talent pipeline plays a far more decisive role in shaping long-term competitiveness than reputation alone. In practical terms, national “smartness” is best understood as a measurable asset that influences productivity, innovation and economic growth.
To capture this, the team at TradingPlatforms moves beyond perception and focuses on data. We combined student performance in global assessments (PISA), scientific publications per capita, researcher density and national average IQ estimates to build a composite indicator of cognitive and intellectual capacity. The result offers a clearer, metrics-led view of which countries are systematically investing in talent – and how that investment translates into real-world knowledge creation and global influence.
Key takeaways
- Singapore emerges as the smartest country in the world, achieving an impressive 85.3 /100 points on the Global Smartness Index. It is also the country with the smartest youth, averaging 560 points across math, reading, and science on the latest PISA assessment results.
- With the world’s highest average IQ at 107.73 (up from 107.06 in 2024), Hong Kong highlights East Asia’s cultural emphasis on rigorous learning.
- Europe’s smartest country is Switzerland (73/100), Canada (62.3/100) leads in North America, and Chile (26.4/100) ranks first in South America.
World’s Smartest Countries
Data source: OECD, Nature.com, International-IQ-Test.com, United Nations
Main Findings
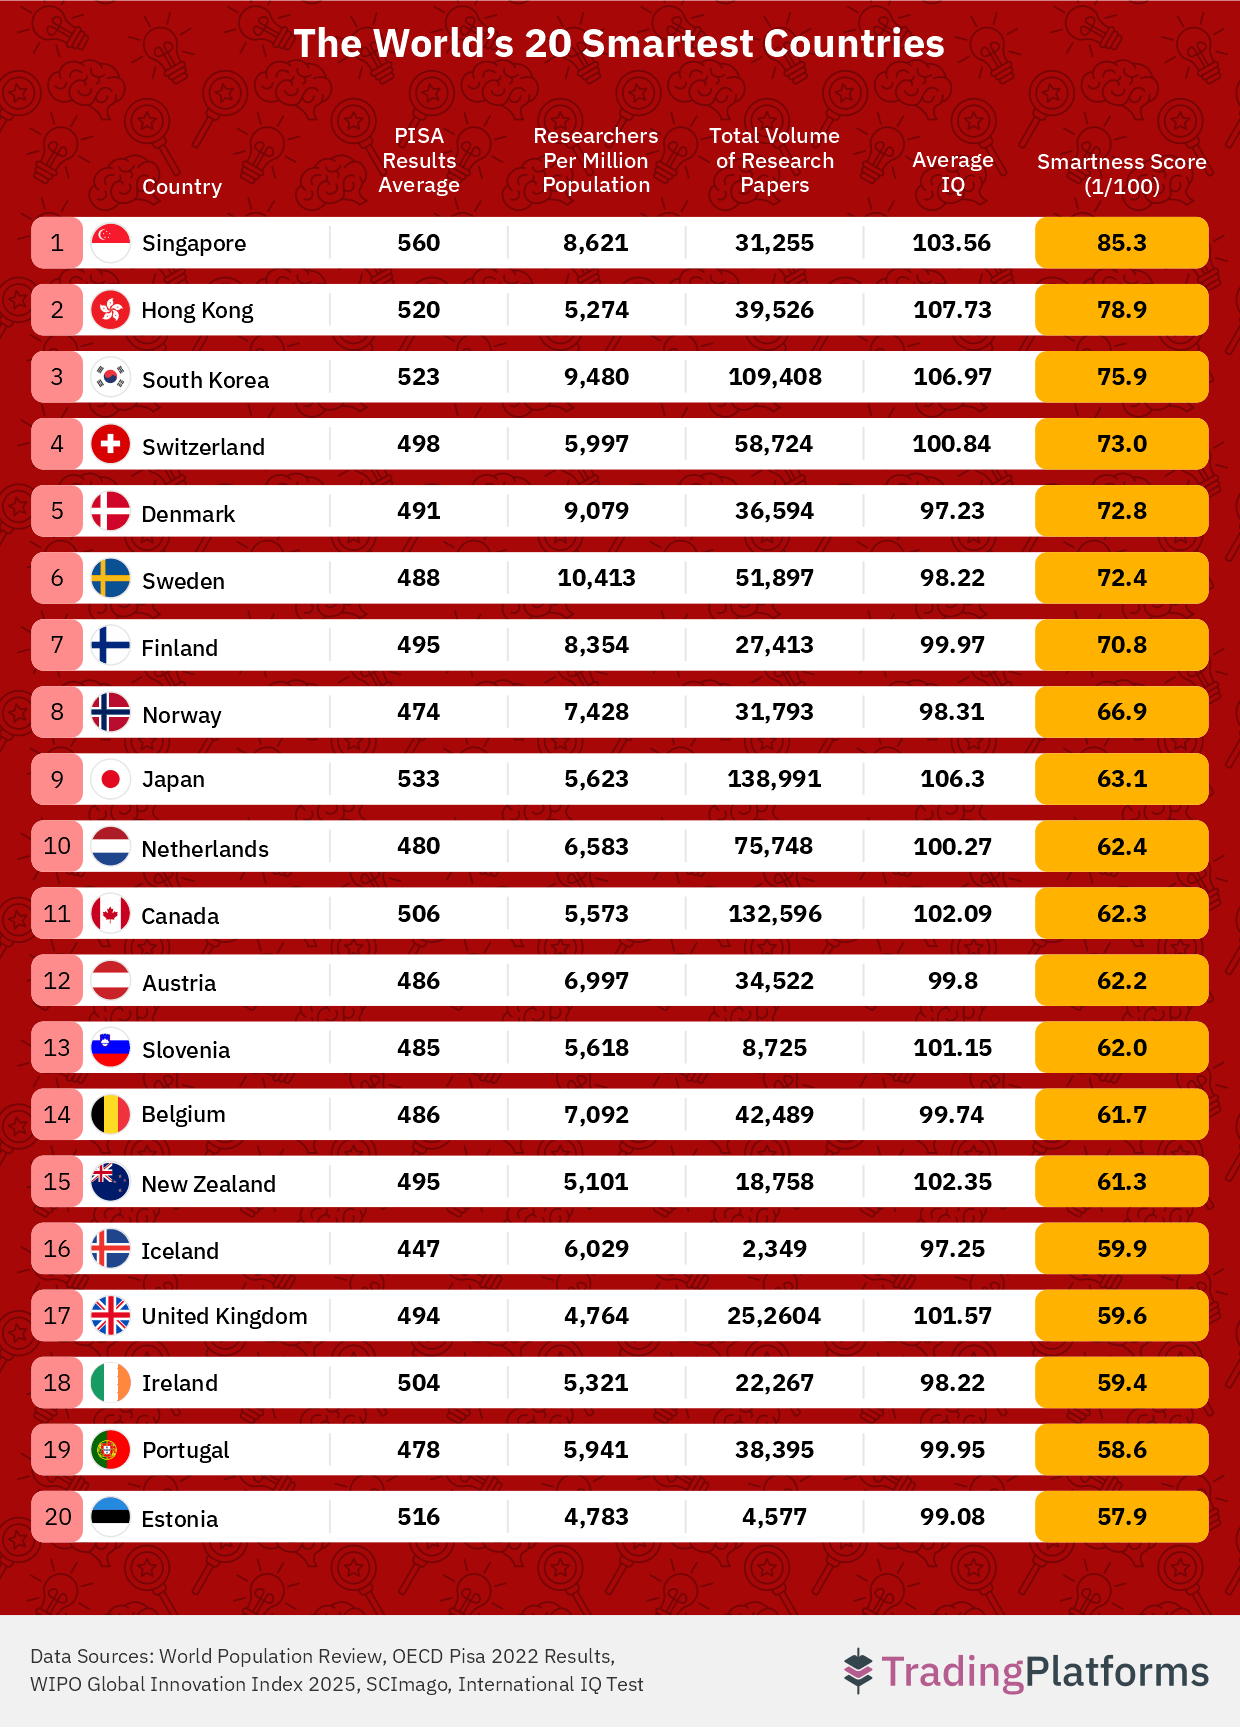
Singapore ranks first on the global Smartness Ranking (85.3/100), driven by the highest PISA average score of 560 points among the 71 countries analysed. In addition, the average IQ in Singapore in 2025 stood at 103.56, the fourth-highest in the world after Hong Kong (107.73), South Korea (106.97), and Japan (106.3). The Asian country also has one of the world’s largest concentrations of researchers per million people, roughly 8,621 per million population. This blend of early educational excellence and elite research capacity gives Singapore an unmatched edge.
Sweden has the highest density of researchers per million citizens out of any country in the dataset, at 10,413 per million, while Switzerland and Denmark pair a highly educated population with some of the strongest scientific publishing records per capita globally, 6,519 published papers per million for Switzerland and 6,075 per million for Denmark. The result is a cluster of small, high-efficiency knowledge economies that punch far above their population weight.
North America’s sole representative in the global top 20 is Canada, ranking 11th overall with a Smartness Score of 62.3/100 points. The country combines strong student performance (506 average PISA score), a high average IQ (102.09), and robust scientific output, producing 132,596 research papers, around 3,277 per million people, supported by a dense research workforce of 5,573 researchers per million.
The Smartest Countries in Europe
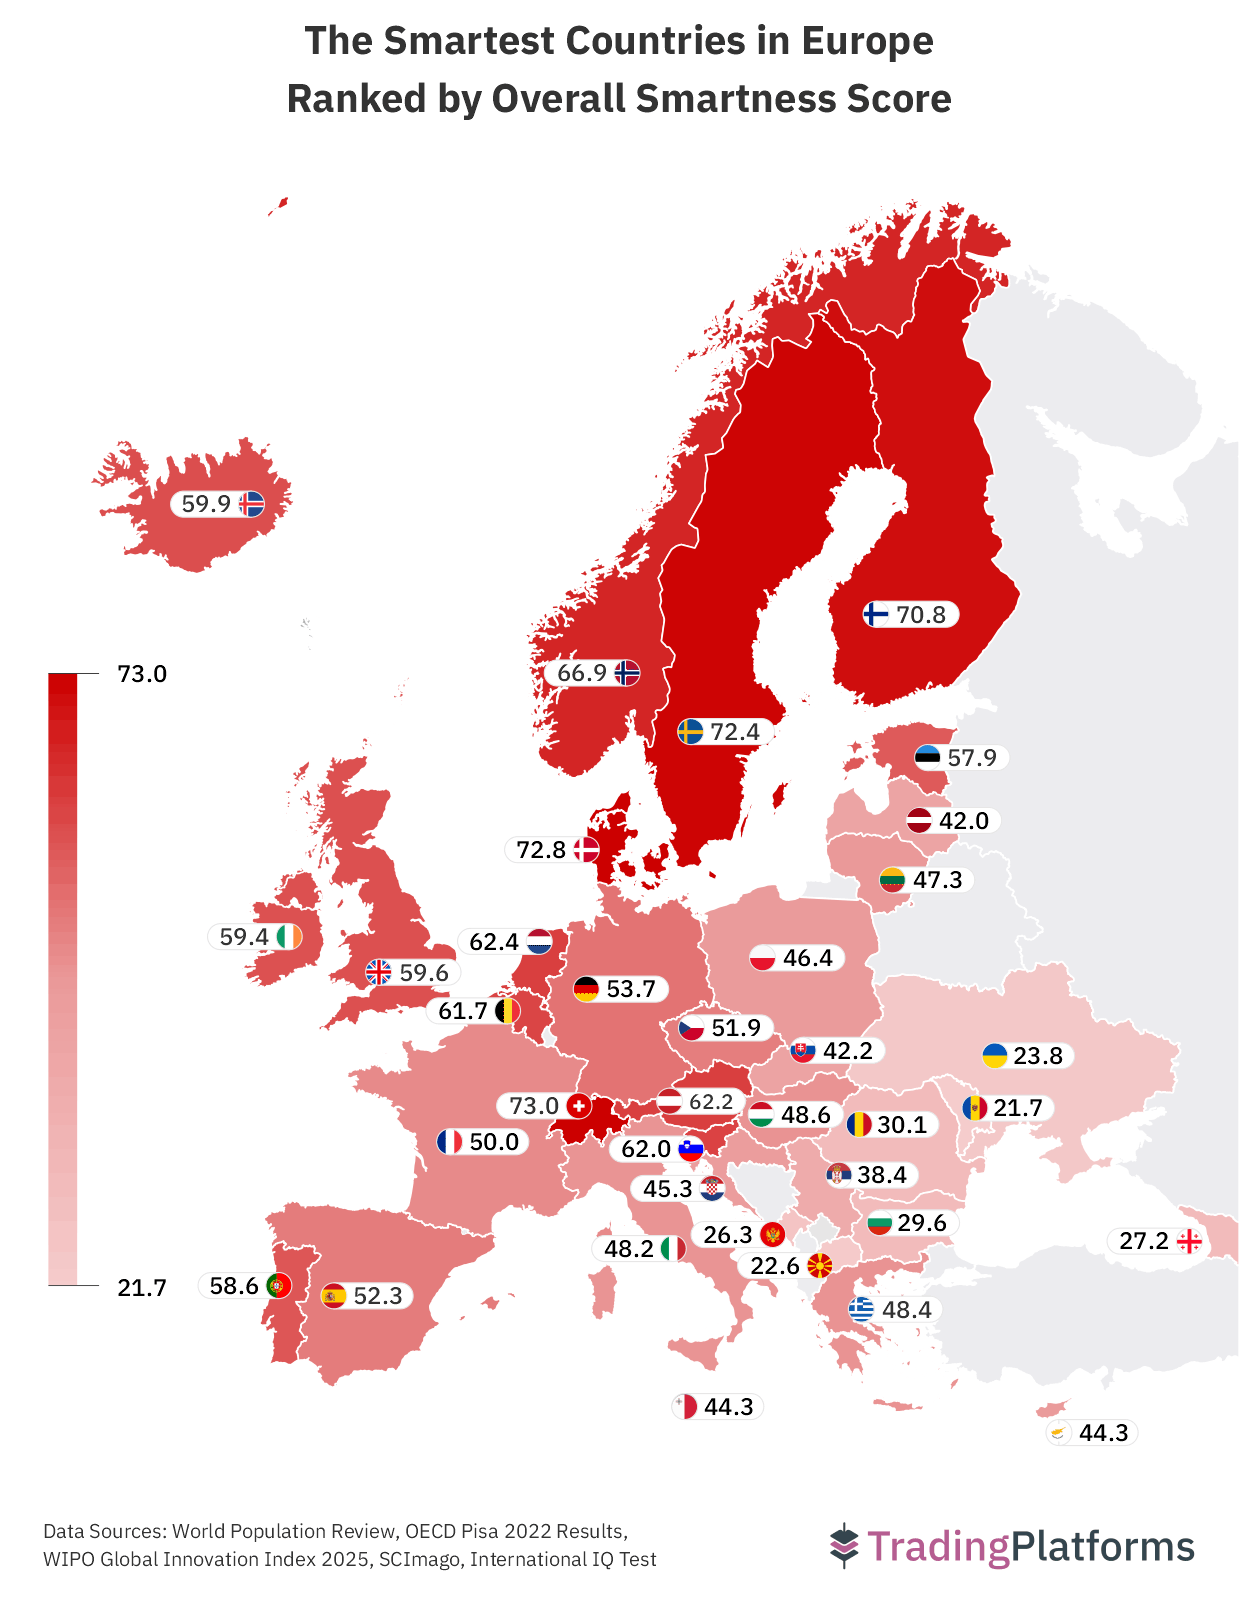
Europe dominates the global smartness rankings, with 14 of the top 20 smartest countries located on the continent. Switzerland leads the region with a combined smartness score of 73/100 points, boasting a strong PISA average of 498 and one of the world’s highest research outputs per capita (6,519 publications per million) alongside a dense research workforce (5,997 researchers per million). The Nordic countries follow closely behind: Denmark (72.8/100), Sweden (72.4/100), Finland (70.8/100), and Norway (66.9/100) all perform well above the global average across key smartness indicators. Their strong scores reflect the same winning formula: consistently high student performance paired with deep investment in research and innovation.
In Central and Western Europe, the Netherlands (62.4/100), Austria (62.2/100), Slovenia (62/100), and Belgium (61.7/100) combine high PISA averages between 480 and 486 points, with a high concentration of researchers per million population (about 5,600-7,100 researchers per million). We see the same in the United Kingdom and Ireland, with excellent student performance on the PISA assessment paired with significant research output in absolute terms, but their per-capita researcher density (4,764 and 5,321 per million, respectively) trails the Nordics.
In Focus: Nations Ranked by IQ
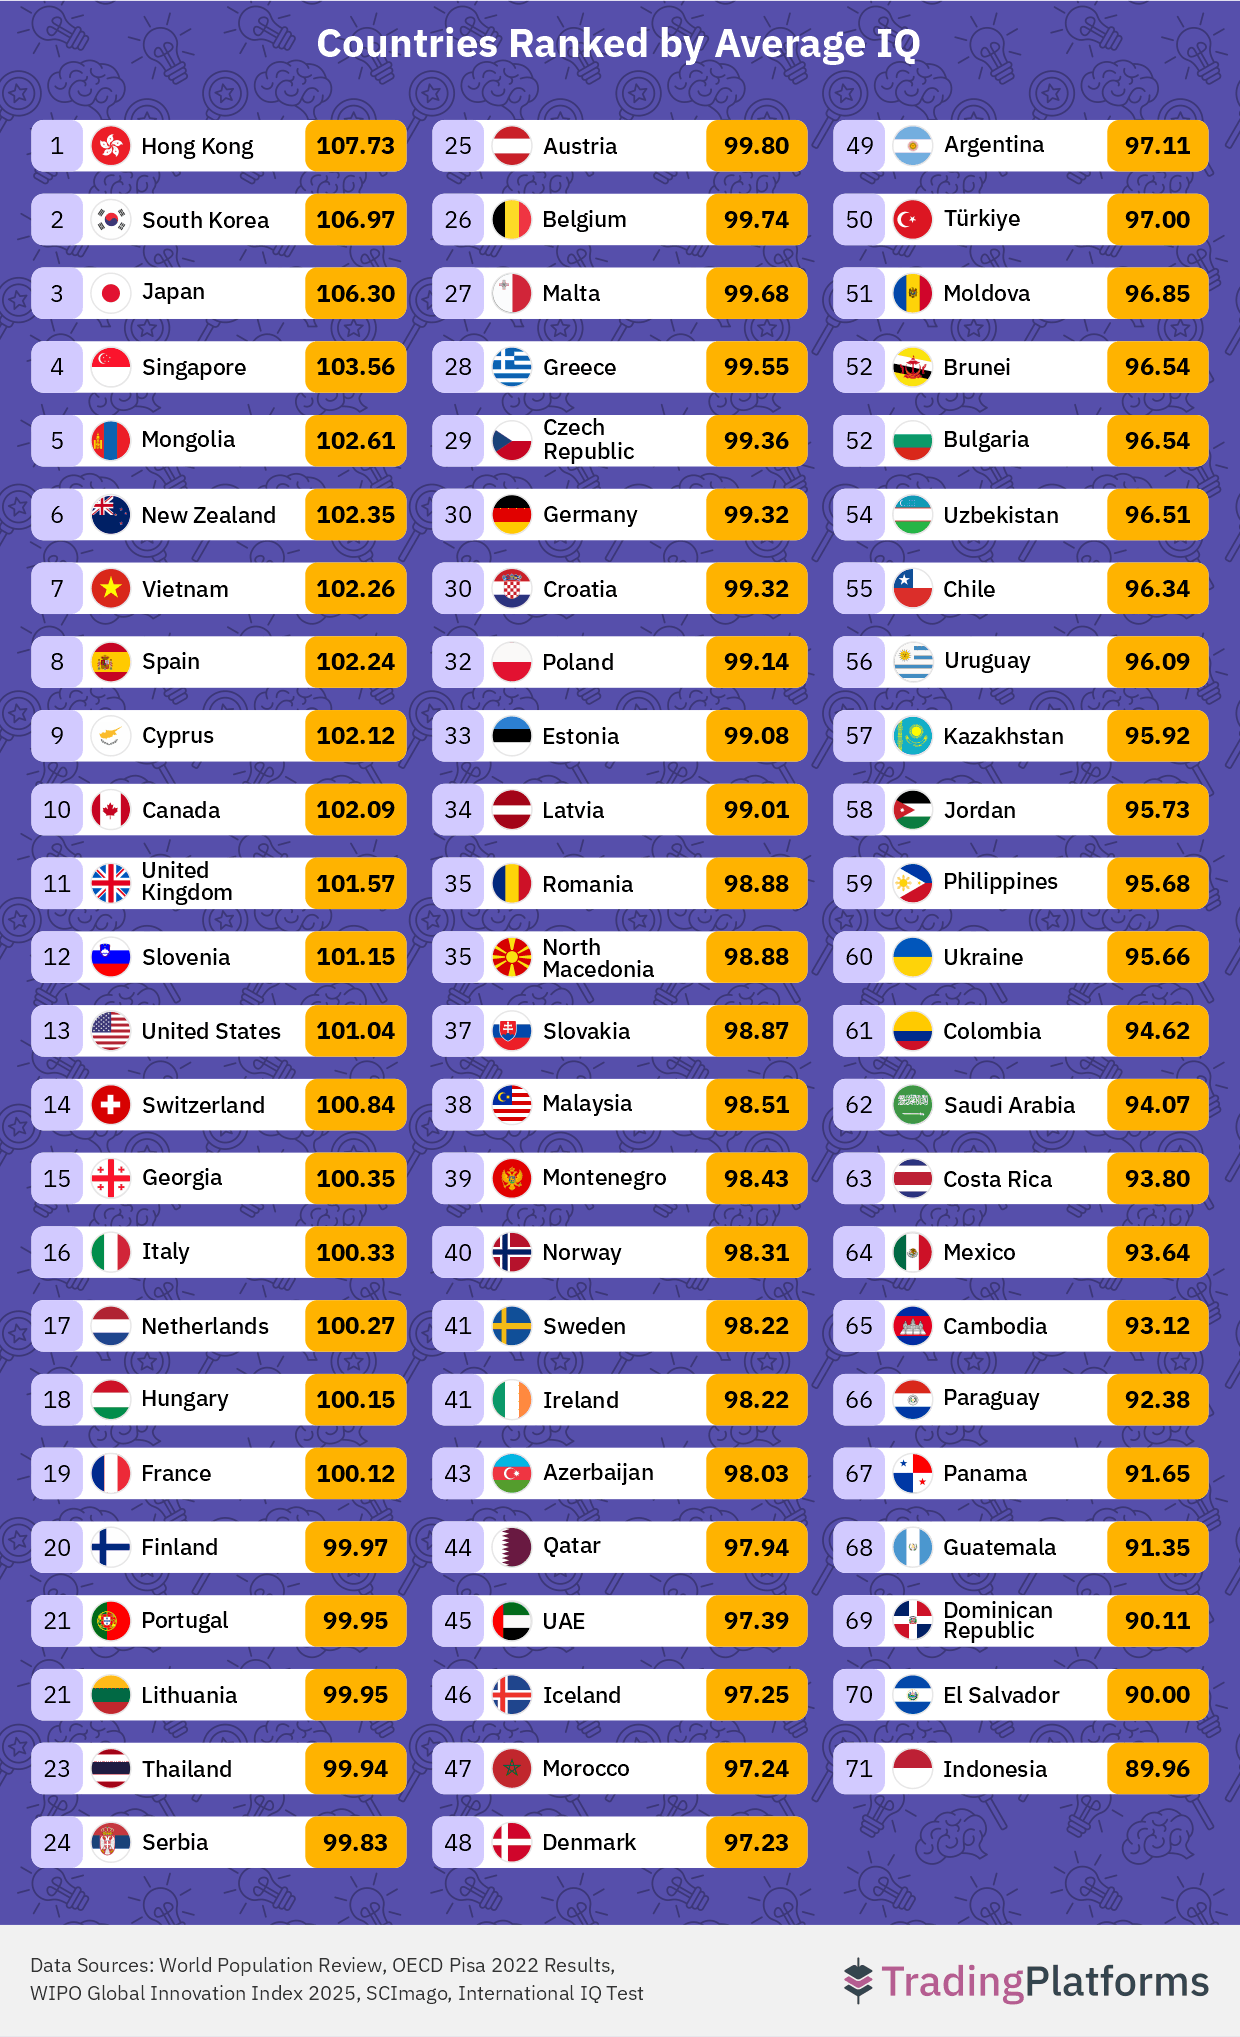
IQ, or intelligence quotient, is a measure of cognitive ability that reflects skills such as reasoning, problem-solving, and learning. The concept originated in the early 1900s when French psychologist Alfred Binet developed the first intelligence test to identify schoolchildren who needed extra academic support. Multiple variations of the original test were introduced and eventually, the concept of a smartness measure led to the term ‘intelligence quotient’ (IQ), coined by German psychologist William Stern in 1912.
Since then, IQ testing has been widely used in psychology, education, and even military recruitment. While the specific tests and methods have evolved, the idea of using standardised tasks to estimate cognitive ability has remained in use for over 110 years. While it does not capture the full complexity of intelligence, IQ remains a useful benchmark for comparing cognitive performance across individuals and nations.
In 2026, East Asia remains a global powerhouse in cognitive performance. Hong Kong boasts the highest average IQ in the world at 107.73, followed closely by South Korea (106.97), Japan (106.3), and Singapore (103.56). These figures reflect the region’s long-standing emphasis on rigorous education, highly competitive school systems, and strong cultural investment in learning, factors that help explain why East Asian economies also tend to perform strongly in research and innovation.
Beyond Asia, several countries show average IQs exceeding 100, namely Canada (102.1), New Zealand (102.3), Switzerland (100.8), Slovenia (101.2), and the Netherlands (100.3), While higher national IQ averages often align with strong education systems, differences in testing methods, population composition, and national priorities around skills development and research investment can all shape how these figures compare across regions.
In contrast, many countries in Latin America, the Middle East, and Southeast Asia record lower averages, typically clustering in the high-80s to mid-90s. Mexico (93.64) and Colombia (94.62) sit near the middle of this range, while Guatemala (91.35), Panama (91.65), and the Dominican Republic (90.11) fall toward the lower end. These gaps are mostly due to gaps in the quality of education, access to learning resources, and socioeconomic opportunity, reinforcing the idea that national cognitive performance is shaped not just by innate potential, but by long-term investment in human capital.
Nations Ranked by Scientific Research
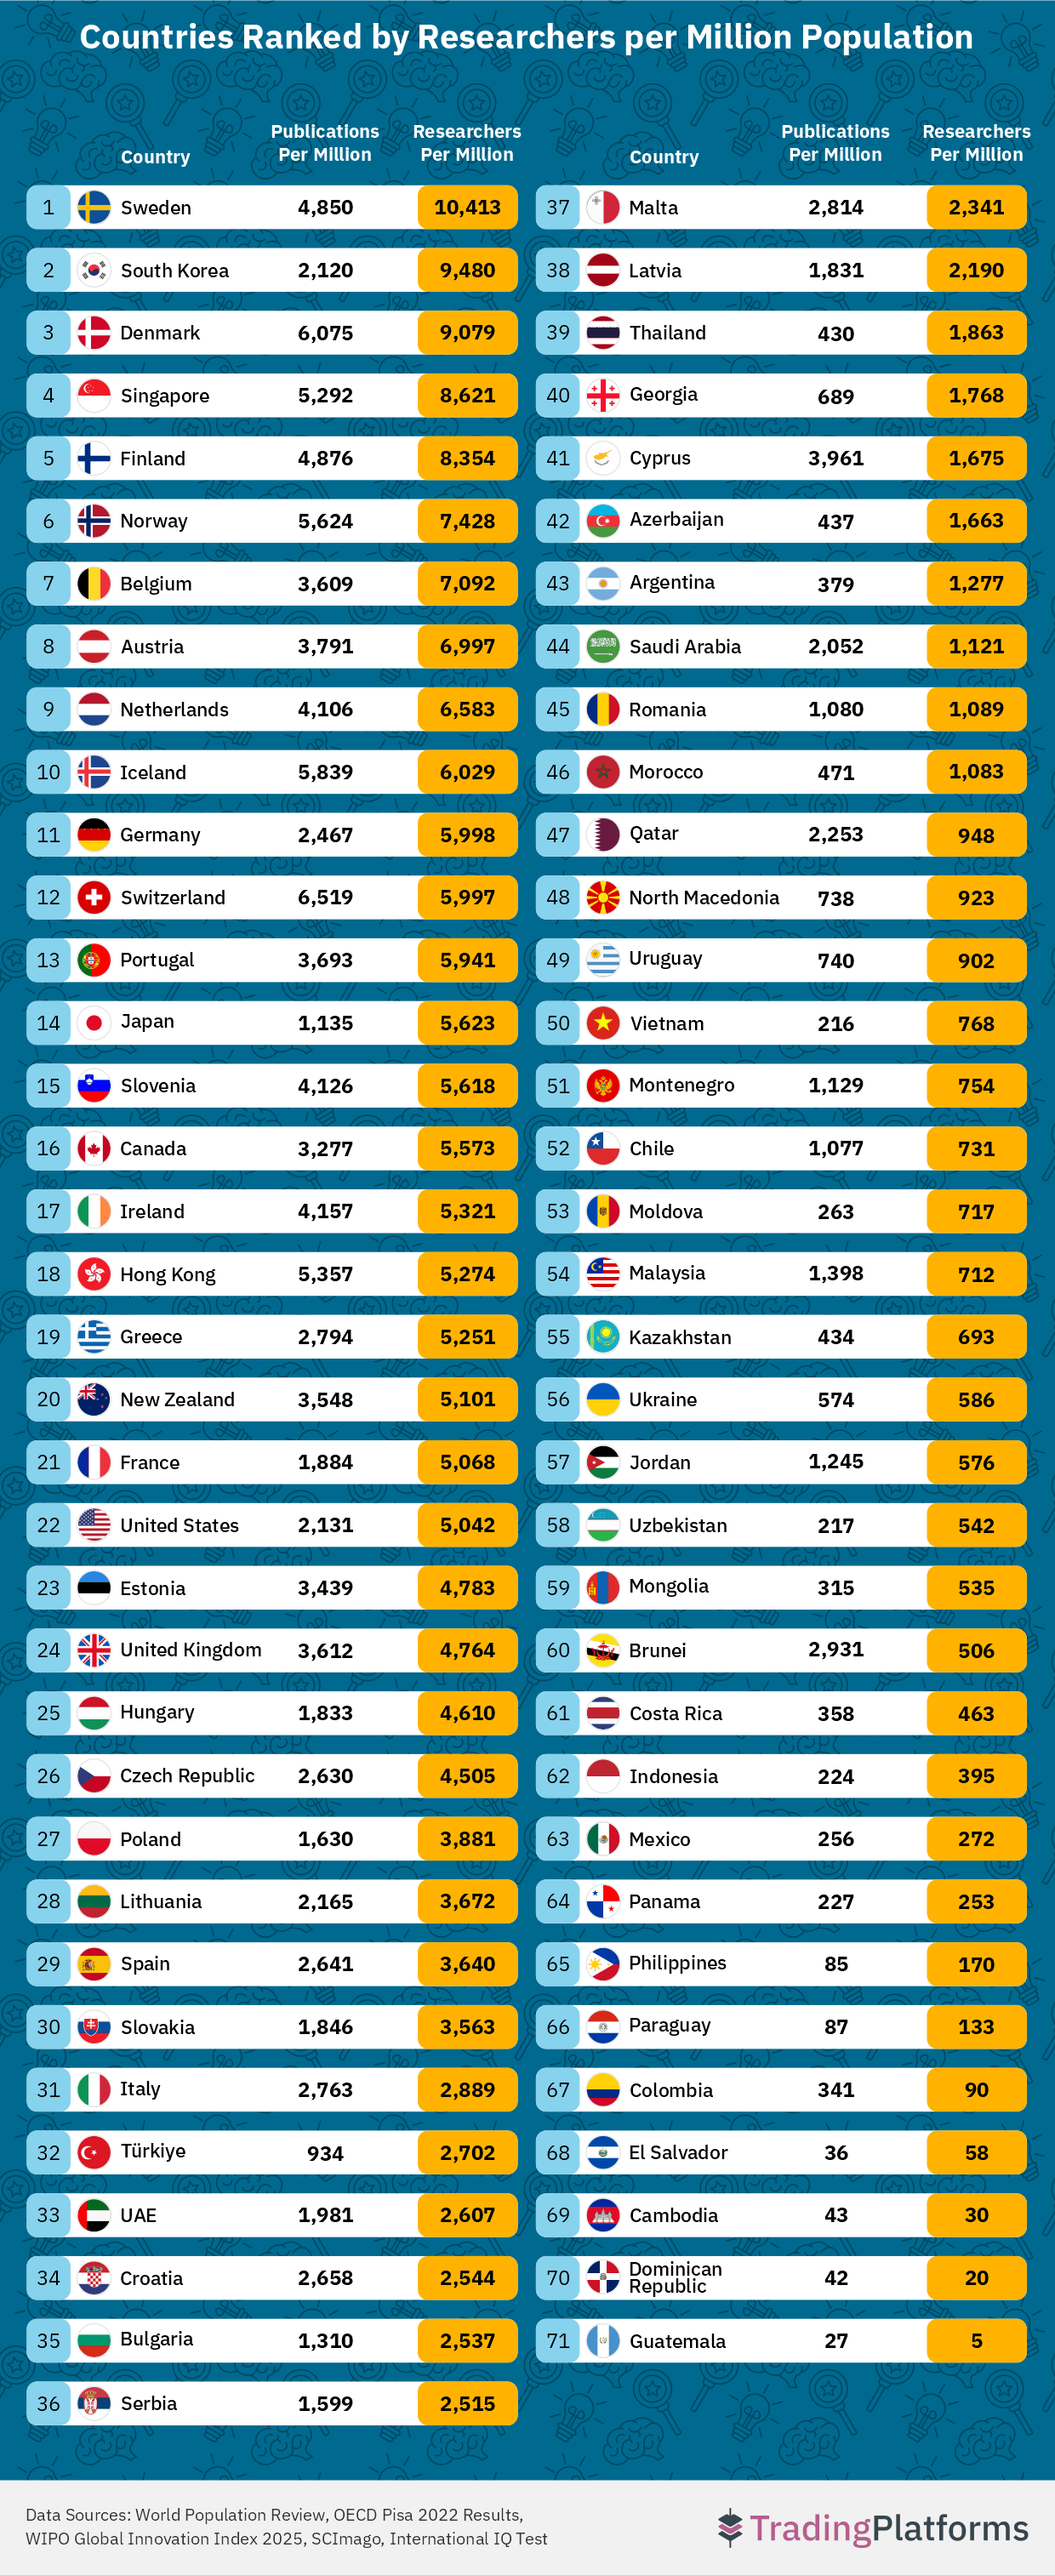
In terms of research intensity, Nordic and Central European countries are in the lead. Sweden, with a population of around 10.7 million, has the highest researcher density in the dataset, 10,413 researchers per million, who produced roughly 51,897 scientific papers in 2024, equivalent to about 4,850 publications per million residents. Denmark (9,079 researchers per million) and Finland (8,354) follow closely, while Norway (7,428 researchers per million) also boasts a strong research culture.
Beyond the Nordics, smaller European nations excel in per-capita output. Switzerland supports a sizable research community (5,997 researchers per million citizens) and leads globally in publishing intensity, producing around 6,519 papers per million. Similarly, Iceland combines a dense workforce (6,029 researchers per million) with one of the highest per-capita publication rates in the dataset, at roughly 5,839 papers per million.
East Asia shows a different but equally impressive research profile. South Korea leads the region in research intensity, boasting the second-highest density of scientists per capita of 9,480 researchers per million, followed by Singapore (8,621) and Japan (5,623).
Hong Kong, by contrast, delivers exceptionally high per-capita publishing, boasting 5,357 research publications per million population. Together, these patterns point to deep investment in human capital, strong education systems, and a regional culture that prioritises innovation.
In North America, Canada and the United States present contrasting research profiles. Canada combines 5,573 researchers per million with around 3,277 publications per million, reflecting strong research intensity relative to population size. The United States, by contrast, produces the biggest volume of scientific publications out of any country, 743,884 research papers in 2024, but records 2,131 publications per million alongside 5,042 researchers per million, mostly due to its large population of 349 million people diluting per-capita metrics. Both countries remain central to global science, underpinned by dense academic networks and mature research ecosystems.
PISA Rankings
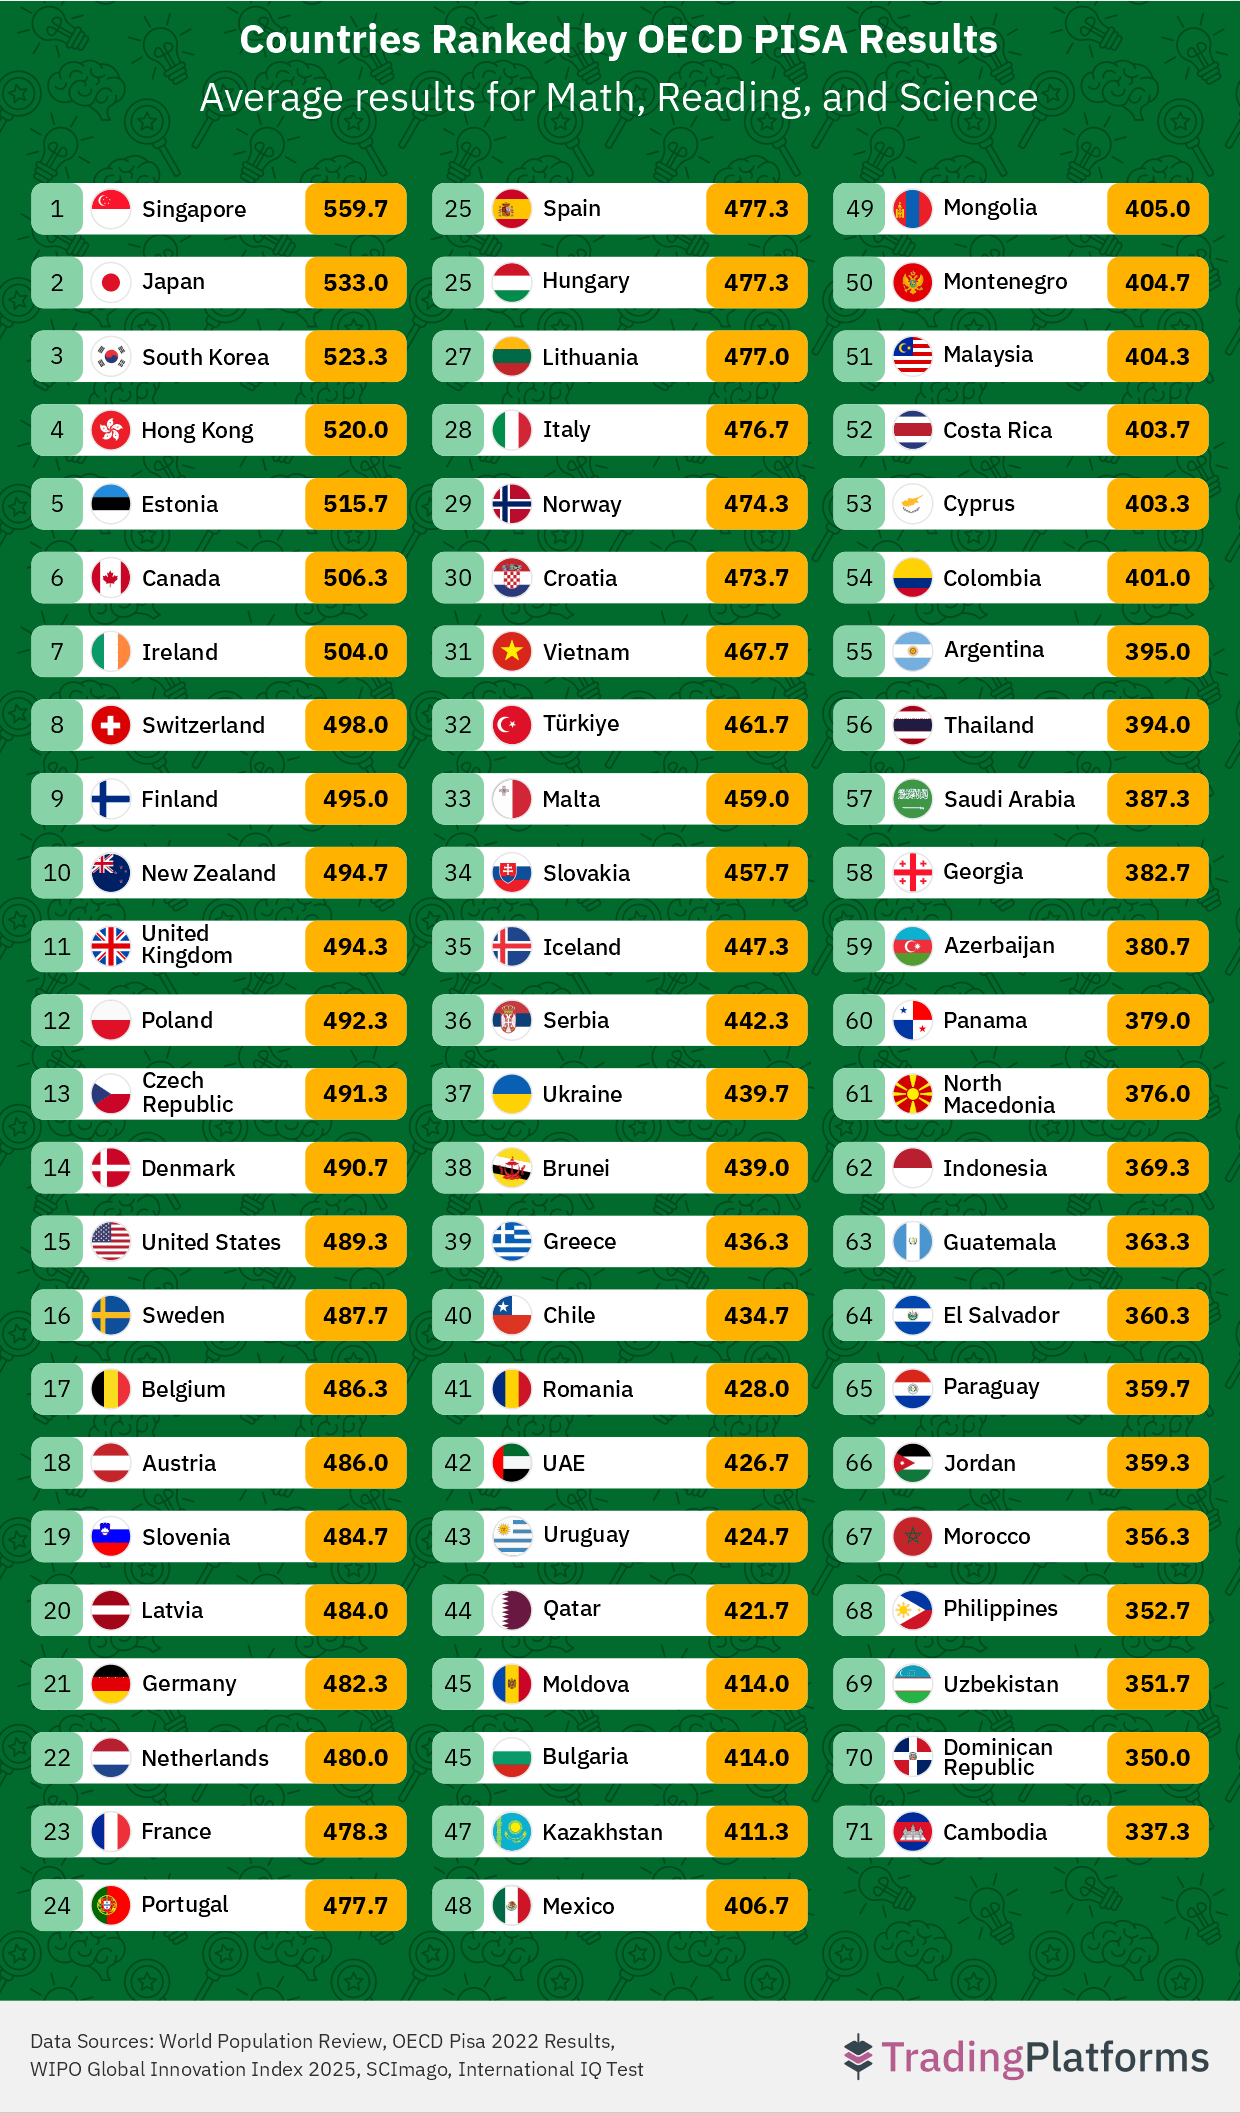
East Asian countries consistently excel in student performance, led by Singapore, which posts an extraordinary average of 560, with scores of 575 in math, 543 in reading, and 561 in science. Japan (533 points) and South Korea (523 points) follow closely, alongside Hong Kong (520 points), demonstrating how sustained cultural emphasis on education, rigorous curricula, and high teaching standards consistently translate into top-tier outcomes. Vietnam (468) and Brunei (439) also show above-average performance relative to their regional peers, highlighting the potential for smaller or emerging economies to punch above their weight with targeted investments in schooling.
Europe presents a more varied picture. Estonian youth achieving an impressive average of 516 points and directly rivalling East Asian peers proves that smaller nations can rival much larger economies when equity and consistency are prioritised. The Nordics, Finland (495 points), Denmark (490.7 points), and Sweden (488 points), perform strongly, particularly in science, reflecting well-funded education systems and an emphasis on teaching quality. Meanwhile, Southern European nations such as Portugal (477.7) and Italy (476.7) fall slightly behind. Switzerland (498) and Ireland (504) provide interesting contrasts, blending solid PISA outcomes with smaller populations and highly efficient education systems.
North America offers a contrasting picture. Canada (506) ranks as one of the highest-performing Western countries, with its youth scoring above 500 across all subjects, reflecting an inclusive, well-resourced system. The United States (489) trails behind in math but performs better in reading and science, highlighting structural inequalities within its schools. Mexico (407), Costa Rica (403.7), Panama (379), Guatemala (363), El Salvador (360.3), and the Dominican Republic (350) cluster lower in the rankings, pointing to the enduring influence of socioeconomic disparities and uneven access to quality education.
Other regions display notable variation as well. Oceania’s New Zealand (494.7) maintains strong results across subjects, comparable with Western Europe, while emerging Asian economies like Malaysia (404.3), Thailand (394), and Indonesia (369) show mixed progress, with scores gradually improving in response to increasing educational investment. The Middle East sees modest results, with Qatar (422) and the UAE (427) performing better than their regional peers but still below global leaders. Latin America and Africa continue to face systemic challenges, as illustrated by Chile (435), Argentina (395), and Morocco (356), underscoring the persistent impact of inequality, resource constraints, and uneven educational policy implementation on student outcomes.
Methodology
To compare how ‘smart’ different nations are in relative terms, TradingPlatforms combined multiple measurable indicators rather than relying on any single proxy, such as IQ alone. Each country’s Smartness Score is built from four dimensions that capture different stages of how intelligence is developed and applied: student performance, research participation, scientific output, and average cognitive ability.
Student performance is measured using the latest available results from the OECD Programme for International Student Assessment (PISA) from 2022. PISA evaluates the real-world problem-solving abilities of 15-year-old students across mathematics, reading, and science. Rather than testing memorisation, the assessments focus on how effectively students can apply knowledge to unfamiliar situations. For each country, the three subject scores were averaged to create a single student performance measure, allowing for consistent cross-country comparison.
Scientific output was measured using national research publication totals from 2024 provided by SCImago Journal Rank. To account for population size and avoid bias toward larger countries, publication counts were converted into research papers per million residents using updated population estimates for 2024. This ensures that smaller countries with high research intensity are fairly represented alongside larger research-producing nations.
Research participation was captured using the number of researchers per million inhabitants, sourced from the Global Innovation Index 2025 dataset. This metric reflects how many people in each country are directly engaged in research roles, helping distinguish between countries that merely publish large volumes of research and those with dense, highly skilled research workforces.
Cognitive ability was measured using average national IQ scores compiled by the International IQ Test. While IQ alone cannot capture the full complexity of intelligence, it provides a broad comparative benchmark for general cognitive performance across populations when used alongside educational and research-based indicators.
To produce the final Smartness Score, each metric was normalised onto a 1-100 scale, allowing results from different sources and units to be compared directly. The four normalised scores were then combined with equal weighting to generate each country’s overall score. This approach ensures that no single factor dominates the ranking, and that countries are assessed based on a balanced mix of educational outcomes, research capacity, scientific contribution, and cognitive benchmarks.